

Yes, automate your client SEO reports. Connect Google Search Console, GA4, and PageSpeed Insights to a scheduling tool, standardize one template across every account, and let the system flag anomalies between cycles. Agencies that do this cut report production from hours to minutes per client, catch ranking drops before clients notice, and free account managers to spend time on strategy instead of copy-pasting screenshots. The rest of this guide walks through the exact setup, from data connectors to the template clients actually read.
TL;DR:
- Automated reports save time by pulling core metrics from Search Console, GA4, and PageSpeed Insights, reducing production from hours to minutes.
- Clients prioritize key figures like sessions, clicks, impressions, conversions, and ranking changes, with Core Web Vitals prominently displayed on page one.
- Proper setup involves defining audiences, mapping data sources, scheduling delivery, and pairing automated summaries with anomaly alerts for early problem detection.
- Automation must be complemented with human judgment for strategic decisions, interpretation of rank drops, and client communication on complex issues.
- Selecting a scalable tool requires feature completeness, ease of setup, customization options, and reliable integrations to prevent manual reconciliation and data silos.
Table of Contents
- What Is Automated SEO Reporting, and When Should You Use It?
- Core Metrics and KPIs Every Automated Client SEO Report Must Include
- How to Build, Schedule, and Deliver Automated Reports
- What Should a Client-Facing SEO Report Template Include?
- Common Mistakes That Undermine Automated Reports
- How Do You Measure the ROI of Reporting Automation?
- Pricing Models and Total Cost for Reporting Automation Tools
- What to Look for When Choosing a Reporting Tool
- How Do You Onboard Clients to Automated Reports?
- Security and Data Privacy When Automating Client Reports
- Where Automation Should End and Human Judgment Begins
- How Stellor Automates Reporting Without the Tool Sprawl
- Authoritative Resources for Reporting Standards
- Sources
- FAQ
What Is Automated SEO Reporting, and When Should You Use It?
Automated SEO reporting means three things run on a schedule instead of by hand: data pulls from your sources, a templated narrative that explains what the numbers mean, and delivery to the client’s inbox or dashboard. The system does the pulling and the formatting. You still write the strategy.
That distinction matters for deciding what to automate. Routine reporting elements belong on autopilot:
- Traffic, click, and impression totals pulled from Search Console and GA4
- Ranking movement for tracked keywords
- Core Web Vitals scores and crawl error counts
- Month-over-month comparisons and trend charts
- Delivery timing and recipient lists
Strategic analysis still needs a human. No automation tool should decide why a competitor’s new content cannibalized your client’s featured snippet, or whether a Google algorithm update justifies a shift in content priorities. Those calls require someone who knows the account’s history and the client’s business goals.
Agencies managing ten or more accounts feel the throughput gain fastest. A single account manager spending three hours a month per client on manual reporting can only handle so many clients before quality drops. Client satisfaction tends to rise too, mostly because reports arrive on the same day every month instead of whenever someone finds the time.
Core Metrics and KPIs Every Automated Client SEO Report Must Include
Clients don’t care about every metric your dashboard can pull. They care about a handful that map to business outcomes, plus a few that prove the technical foundation is solid.
Start every report with executive summary numbers: sessions, clicks, impressions, and conversions, each compared to the prior period. These four numbers answer the question every client actually asks, which is “did this work?”
Search-quality KPIs come next. Average position, click-through rate by query, and a short list of the keywords that moved the most, up or down, in the reporting window. Flagging your biggest position gains and your biggest losses side by side is more useful than a giant table of every tracked term.
Technical and performance KPIs round out the picture:
- Core Web Vitals scores (LCP, INP, CLS) from PageSpeed Insights
- Index coverage issues from Search Console
- Crawl errors or newly broken pages
- Mobile usability flags
Pro Tip: Don’t bury Core Web Vitals in an appendix. A client whose site fails Largest Contentful Paint on mobile needs to see that on page one, not page nine, because it directly affects the rankings you’re reporting on.
For top pages and queries, show five to ten rows, not fifty. Sort by conversions or clicks, not impressions, since impressions inflate easily and mean little on their own. One useful framing: users are less likely to click links when an AI-generated summary appears in search results, which means impression counts can climb even as clicks stay flat. If you don’t explain that shift, clients assume something broke.
How to Build, Schedule, and Deliver Automated Reports
Setting up client SEO reporting automation is a one-time investment per client that pays off every month after. Here’s the sequence that works at agency scale:
- Define the audience and cadence for each account. A retained enterprise client might want weekly dashboards; a smaller local business client is usually well served by monthly reporting.
- Map every template field to a specific data source. If a field says “organic conversions,” know exactly which GA4 event or goal feeds it, so nobody has to guess later.
- Connect accounts through secure OAuth wherever possible, and store credentials in your reporting platform’s vault rather than in shared spreadsheets.
- Automate the narrative layer. Modern reporting tools generate plain-language summaries of what changed and flag anomalies, like a sudden 40% drop in impressions, automatically. Pairing scheduled reports with anomaly alerts creates an early-warning system that catches problems between reporting cycles instead of a month later.
- Schedule delivery to the channel each client prefers, whether that’s email, a shared dashboard link, or a Slack channel, and set alert thresholds for anything that needs immediate attention.
- Run a monthly sanity check on one or two accounts to catch drift, and do a deeper quarterly review of the template itself to retire metrics nobody reads and add ones clients are actually asking about.
Most agencies find it easier to launch this with a narrow scope. Starting with a small set of repeatable reports, monthly traffic summary, site health, and rank movers, before expanding into custom dashboards keeps the rollout manageable across a full client roster.
What Should a Client-Facing SEO Report Template Include?
A report clients actually read leads with the business answer, not a data dump. Vendor playbooks converge on the same structure for good reason: it mirrors how clients want the story told, what changed, why it changed, what happens next.
Structure the report in four parts:
- Cover page: client name, reporting period, and the primary goal being tracked (leads, revenue, visibility)
- Executive summary: three to five sentences covering what changed, the likely cause, and the next action, before any chart appears
- Evidence pages: the KPIs from the section above, top movers, technical issues, and conversion data, each with a one-line explanation
- Appendix: data source list and a note on how each key metric is calculated
| Section | Core Question It Answers | Typical Length |
|---|---|---|
| Executive summary | Did this work, and what’s next? | 3-5 sentences |
| KPI evidence | What moved, and by how much? | 1-2 pages |
| Technical issues | Is anything broken or slowing us down? | Half a page |
| Appendix | Where did these numbers come from? | Few lines |
Keep the appendix short but never skip it. One line per metric, naming the source and the date range, is usually enough to head off a dispute before it starts.
Common Mistakes That Undermine Automated Reports
Automation removes manual labor, not judgment. The mistakes that damage client trust almost always come from treating the output as gospel instead of a draft.
- Claiming causation without verification. A traffic spike that coincides with a new blog post isn’t proof the post caused it; check referral sources and seasonal patterns before writing that sentence.
- Letting OAuth tokens expire unnoticed. A report that silently shows zero data for three weeks is worse than no report at all, because nobody catches it until the client asks.
- Writing bloated commentary. If a metric barely moved, say so in one sentence and move on. Padding a flat month with three paragraphs of filler erodes trust faster than an honest “no significant change.”
- Over-aggregating multi-location or multi-service accounts. Rolling ten locations into one blended number hides the two locations that are actually struggling, which is exactly the signal the client is paying you to surface.
Run a quick monthly audit on a sample of accounts to catch these before a client does.
How Do You Measure the ROI of Reporting Automation?
Track two categories: what the agency saves internally, and what the client experiences externally. Internally, log hours saved per report and the error rate before and after automation. Vendor estimates suggest automation can cut report production from hours to minutes once connections are configured, a number worth validating against your own team’s time logs rather than taking at face value.
| Metric | What to Track | Why It Matters |
|---|---|---|
| Hours per report | Time from data pull to client delivery | Direct labor cost savings |
| Error rate | Corrections needed after client review | Signals data integrity |
| Client renewal rate | Retained accounts month over month | Reporting quality affects perceived value |
| Time to issue detection | Days between a problem occurring and it being flagged | Faster detection means faster fixes |
A simple ROI formula: (hours saved per month × account manager hourly rate) minus (monthly cost of the reporting tool) equals net monthly savings. Run that math across your full client roster, not one account, since the gains compound with volume. An agency saving even two hours per client across thirty clients recovers sixty billable hours a month, which is often the equivalent of hiring most of another team member.
Pricing Models and Total Cost for Reporting Automation Tools
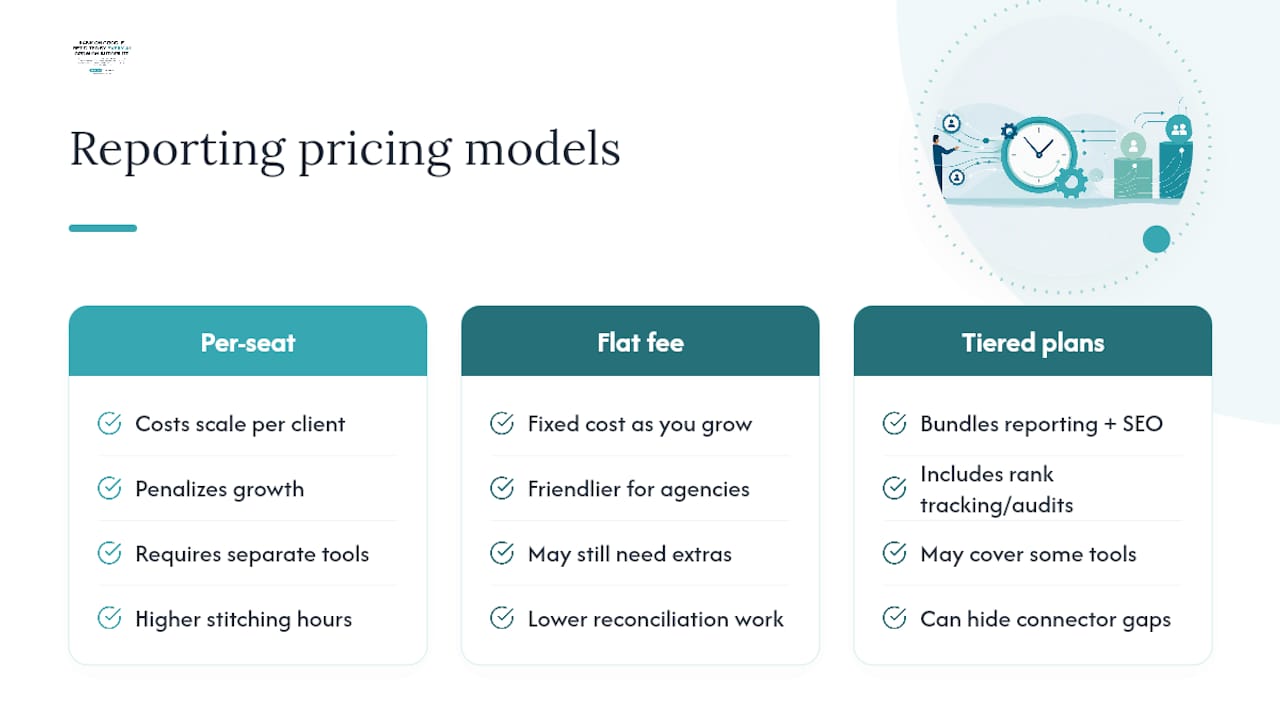
Reporting automation tools generally price one of three ways: per client or per report seat, flat monthly platform fees regardless of client count, or tiered plans that bundle reporting with broader SEO features like rank tracking and audits.
Per-seat pricing punishes growth. Add ten new clients and your bill scales linearly, which stings for agencies onboarding clients faster than they’re raising rates. Flat platform fees are friendlier for growing shops because the cost stays fixed while your client count climbs.
The real cost isn’t the subscription line item. Factor in the hours your team spends stitching together data from a reporting tool, a separate rank tracker, a technical audit tool, and a backlink monitor, plus the risk of one connector breaking and nobody noticing until a client complains. Point solutions that only handle reporting still leave you paying for the other four tools separately, and reconciling data across all of them by hand.
Before signing anything, ask what happens to your report history and templates if you cancel. Some platforms lock your historical reports behind the subscription, which turns a routine vendor switch into a data-loss event. Get a straight answer on this before committing, not after your first renewal notice.
What to Look for When Choosing a Reporting Tool
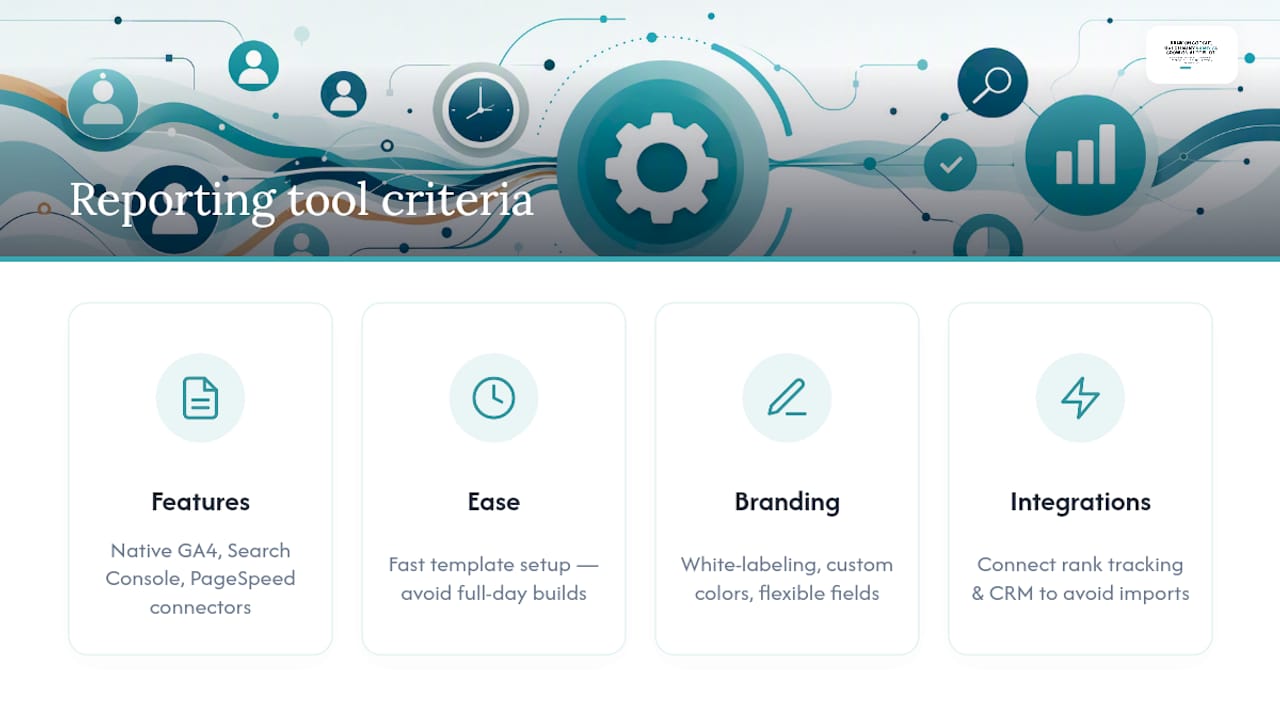
Four criteria separate a tool that scales with your agency from one you’ll outgrow in a year.
Feature completeness matters more than feature count. A tool with native GA4, Search Console, and PageSpeed connectors covers the core metrics clients expect without CSV workarounds. Check whether it handles Core Web Vitals and technical audit data natively or requires a separate tool bolted on.
Ease of use shows up fastest in template setup time. If building your first client template takes a full day, multiply that by however many unique report structures your roster needs.
Customization determines whether reports feel branded or generic. White-labeling, custom color schemes, and flexible field mapping let you match each client’s expectations instead of sending an obviously templated PDF.
Integrations decide how much manual reconciliation survives automation. A tool that only connects to Google’s own products still leaves rank-tracking and CRM data as manual imports, which reintroduces the exact bottleneck you’re trying to eliminate.
Test any shortlisted tool against a real, messy client account before rolling it out agency-wide. A demo account with clean data hides the edge cases, like a client with three GA4 properties or a site migration mid-quarter, that actually break templates in production.
How Do You Onboard Clients to Automated Reports?
The biggest onboarding risk isn’t the technology. It’s a client who expects the old, manually-written report and gets confused by a new format, even if the new one is objectively better.
Set expectations before the first automated report lands. Tell clients explicitly what’s changing: report format, delivery day, and who to contact if a number looks off. A short kickoff call or email walking through a sample report prevents most confusion.
Explain the “why,” not just the “what.” A client who understands that automation means faster issue detection and more consistent delivery is more forgiving of a new layout than one who thinks their account manager just got lazy. Reference measurable outcomes tied to the reporting cadence itself, not just the raw SEO numbers, so clients see the reporting change as an upgrade.
Give clients a channel for questions that doesn’t require waiting for the next report cycle. A quick Slack thread or a standing monthly call to walk through the automated report in person, at least for the first two or three cycles, builds trust faster than a cold PDF in an inbox. After that, most clients prefer the report land, get skimmed in five minutes, and only trigger a call when something actually needs discussion.
Security and Data Privacy When Automating Client Reports
Every connector you add is another access point to a client’s Google account. Treat OAuth scopes with the same discipline you’d apply to any third-party vendor: grant read-only access wherever the platform allows it, and avoid requesting write permissions your reporting tool doesn’t actually need.
Store client credentials in your reporting platform’s encrypted vault, never in shared spreadsheets or plaintext documents passed between team members. Rotate access when an employee leaves the agency, and audit which team members have live connections to which client accounts at least twice a year.
Client data residency matters more for regulated industries, healthcare, legal, and financial services clients in particular, where you may need to confirm where the reporting platform stores exported data and how long it retains it. Ask any vendor directly whether they support data deletion on request and whether their infrastructure meets standards relevant to your client’s industry before connecting a regulated account.
Where Automation Should End and Human Judgment Begins
Automate the parts of reporting that are mechanical: data pulls, chart generation, delivery scheduling, and anomaly flagging. Keep the parts that require judgment in human hands: interpreting why a ranking dropped, deciding what to prioritize next quarter, and having the actual conversation when a client is unhappy with results.
The mistake I see agencies make isn’t under-automating. It’s assuming automation replaces strategy instead of buying time for it. A report that writes itself is worthless if nobody reviews it before it reaches a client’s inbox, and a beautifully automated dashboard doesn’t fix a campaign that’s underperforming. Automation should hand you back the hours you used to spend formatting screenshots, so you can spend them figuring out why a client’s conversion rate stalled while traffic climbed.
Set your cadence deliberately, connect your real-time tracking sources properly, and treat the resulting time savings as a strategy budget, not a reason to take on twice the clients at half the attention per account.
— Cole
How Stellor Automates Reporting Without the Tool Sprawl
Stellor is the alternative to running five separate subscriptions for content, backlinks, audits, and AI tracking. Instead of stitching together a reporting tool, a backlink service, a technical auditor, and a separate AI visibility tracker, Stellor consolidates all of it into one $199 a month platform.
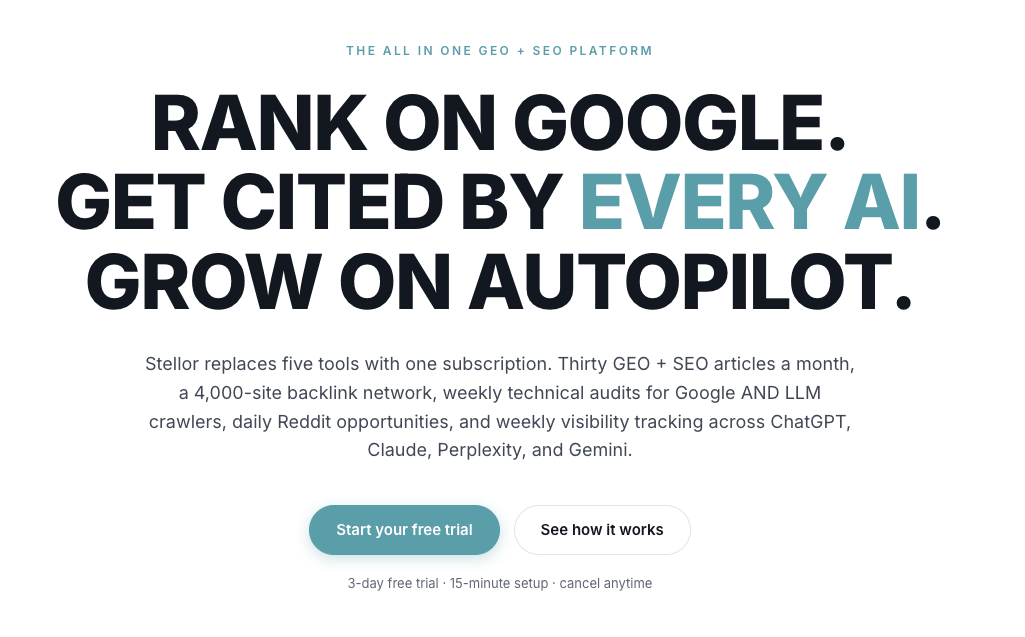
Here’s what that means for your reporting workflow specifically. The platform publishes GEO and SEO-optimized articles monthly to client sites, runs weekly technical audits across multiple checks, maintains backlink placements through a large site network, and tracks weekly AI citations from models such as ChatGPT, Claude, Perplexity, and Gemini. Every one of those outputs feeds the same dashboard, which means your monthly client report pulls from a single, consolidated source instead of four disconnected tools that never quite agree on the numbers.
That matters more now that AI summaries are changing how often users click through to a website at all. A report that only tracks Google rankings misses half the picture. Start a 3 day free trial, no card required, and see what your first automated report looks like when content, backlinks, audits, and AI visibility all live in one place.
Authoritative Resources for Reporting Standards
- Google Search Central for Search Console API details and official metric definitions
- Schema for structured data and markup guidance referenced in technical audits
Sources
Three sources anchor almost every defensible SEO report. Search Console gives you clicks, impressions, average position, and index coverage straight from Google. GA4 supplies sessions, conversions, and channel attribution. PageSpeed Insights supplies Core Web Vitals and lab performance scores. Automated reporting platforms typically pull all three through native connectors, which removes the manual export step that used to eat an afternoon per client.
Supplemental sources fill in gaps the big three don’t cover: rank-tracking exports for keyword position history, technical audit tools for crawl issues, and CRM data if you want to tie SEO activity to closed deals rather than just traffic.
Here’s how to decide between connection types:
- Pew Research — Google users are less likely to click on links when an AI summary appears
Before scheduling anything, run a short verification pass: confirm date ranges match across sources, check that filtered views exclude internal traffic, and spot-check one metric against the native platform. Systems that attach computation notes to each number make this step faster because you can see exactly how a figure was derived instead of guessing.
FAQ
What Is Client SEO Reporting Automation?
It’s the practice of scheduling data pulls from sources like Search Console and GA4, applying a standard template, and delivering reports to clients automatically instead of building each one manually.
Which Metrics Should Every Automated SEO Report Include?
Sessions, clicks, impressions, conversions, ranking movement, and Core Web Vitals scores cover the core business and technical signals clients expect to see each cycle.
Is CSV Upload as Reliable as an API Connection?
API and OAuth connections refresh automatically and reduce stale data risk, while CSV uploads work as a fallback for tools without native connectors but require manual re-uploading.
How Much Time Does Automation Actually Save?
Vendor estimates suggest report production can drop from hours to minutes per client once connections are set up, though actual savings depend on your template complexity and client count.
Does Stellor Handle SEO Reporting Automation?
Stellor consolidates content publishing, backlink tracking, technical audits, and AI visibility monitoring into one dashboard for $199 a month, replacing the need for separate reporting and tracking tools.
How Do I Get Clients Comfortable With a New Automated Report Format?
Walk them through a sample report before the first automated one arrives, explain what changed and why, and offer a short call for the first two or three cycles to build trust in the new format.